DAM Vendors and consultants have long emphasized the need to monitor DAM usage closely. But when I began searching for data on specific benchmarks that matter the most, the most concrete advice I could find was Ralph Windsor’s landmark post, first published back in 2013. (Updates to the original post are highlighted in red for ease in skimming.)
As usual, Windsor’s advice was on point—and really useful. But it didn’t (or perhaps, couldn’t) offer any guidance on specific benchmark values that would help a DAM manager answer the question Ed Koch used to ask as mayor of New York, “How’m I doing?”
So, I decided to investigate the data that we’ve amassed over nearly two decades in the DAM business, looking at organizations who have achieved and maintained consistently high levels of user adoption. My aim was to offer a frame of reference for DAM adoption success, showing both median results on a few key parameters, and results for a group of companies that are outperforming by a substantial margin.
You might call this the “glass is way more than half full” perspective.
A Brief Introduction to Distributed DAM
This post focuses on distributed DAMs—that is, marketing-oriented systems focused on delivering brand assets to the “edge” of the marketing network: dealers, franchisees, resellers, and the advertising and marketing outlets they use to drive demand at the local level.

Distributed DAMs help brands bring order and consistency to their local marketing communities, reducing costs, increasing brand integrity, and acclerating activation.
With this focus, distributed DAMs tend to feature large numbers of users who are relatively unsophisticated—both in their use of web applications and in their understanding of the finer points of creative production. This affects both the breadth and depth of user adoption.
Common Traits of High Performers
In this review of high-adoption distributed DAMs, we concentrated on a subset of applications that outperformed the median — sometimes dramatically — for user adoption, productivity, and satisfaction.
It should be noted that all of the companies in the high-adoption cohort are franchise- or distributor-driven organizations, with a deep cultural commitment to brand execution and franchisee support.
Further, all of the organizations are either (a) the number one players in their field, by market share; (b) one of the fastest-growing organizations in their respective marketplaces; (c) representative of one or more premium brands within their categories; or (d) multiples of the above.
This is where causation and correlation could easily become confused. Are these organizations successful with DAM-based brand management because they are leaders? Or has the successful use of DAM been a factor driving their leadership positions? The scientists tell us we cannot know; the pragmatist in me says it’s a little bit of both.
Widespread Adoption
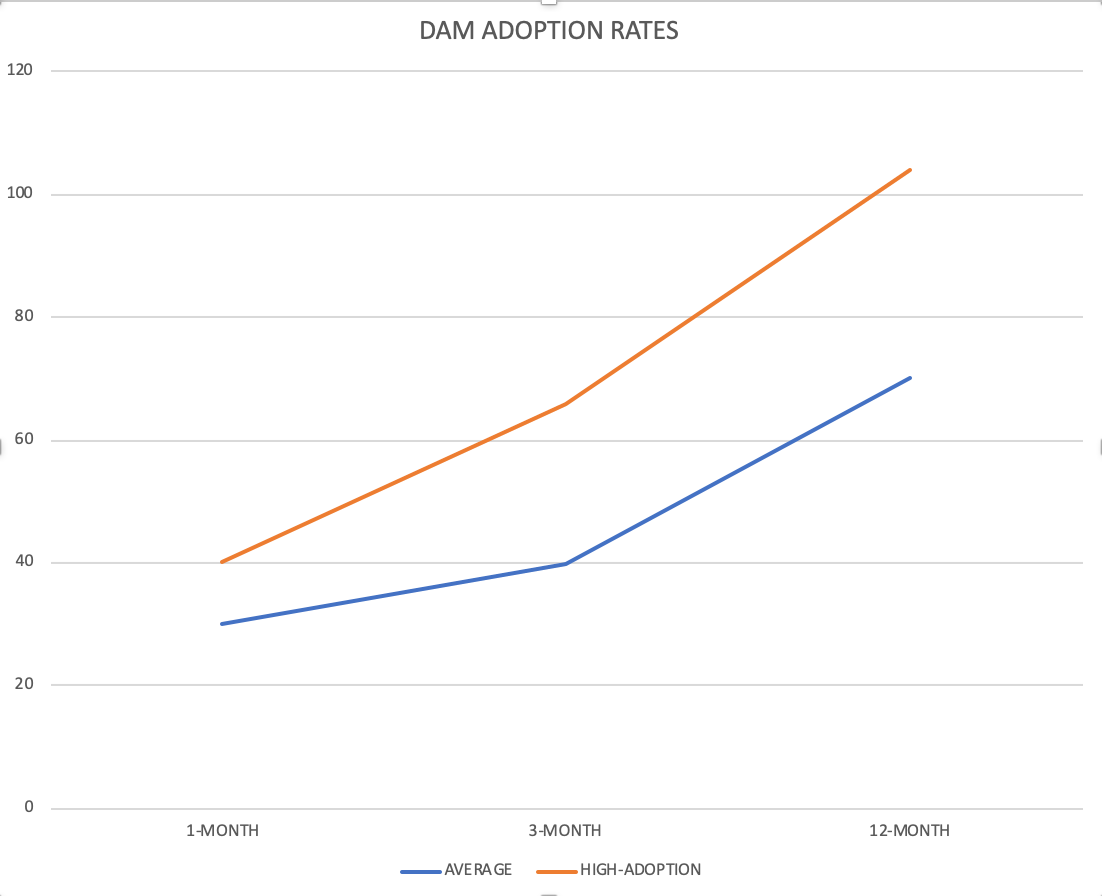
Let’s start with the basic adoption numbers. Figure 1 shows the ratio of active to registered users, at the 1-month, 3-month, and 12-month marks for (a) the average of all applications studied; and (b) the average of high-adoption DAMs.

As you can see, the high-adoption group starts out with a significant lead, and that lead expands over time.
Another point to note, although it’s a little subtle. If you look closely at the adoption rates for the median group, you’ll see the line angles upward significantly from 3-months to 12-months. This is an indication of a large group of users who use the DAM infrequently—what I would call the occasionals. But in the high-adoption group, the slope of the line is consistent across the three data points. This indicates a higher proportion of users who utilize the DAM regularly.
What’s driving this success? All of the organizations in the high-adoption group exhibited the following behaviors.
- They made use of the DAM mandatory — not optional. The users have one place and one place only to retrieve the brand assets they need to run their operations. Said one DAM manager, “We have the luxury of making use of the system a requirement. It’s something that our leadership believes in deeply, and as a result, we have had the ability to make our tools a part of everyday work.” By luxury, what this administrator meant was that she had support from leadership to mandate use of the DAM.
- They shut down other systems as they rolled out their DAMs. In all cases, the decision to eliminate “asset fragmentation” appears to have been decisive to the success of the system.
- They conduct regular training sessions for new and returning users. These webinars tended to be publicized regularly on the systems themselves, and were, in addition, promoted broadly on enterprise intranets and collaboration environments.
- They back up live training sessions with ample video tutorials on specific high-frequency tasks. Consistently, we found that 2–5 minute tutorial videos on asset-upload, asset-tagging, and asset-download and delivery were the most popular with the user community. One of the high performers had produced close to two-dozen video tutorials, which were themselves among some of the most frequently used and re-used materials on the site.
August 2021 Update: Based on recent experience with one of our newest implementations (a leading, distributor-driven brand family in the beverage/spirits category), the numbers above have all moved upward. What's important to note here is the ability of the DAM to win adoption with a user community that is not confined to the brand alone, and for whom DAM usage is not necessarily mandatory. This is a sign of extraordinary success even in the face of mitigating factors.
Deeply Rooted Adoption
Getting the user community to “try” the DAM is a good start. But clearly, high-adoption DAMs are also good at getting users to come back, time after time. Recognizing this, we dove a little deeper into the data to see if we could find evidence that loyalty to the system is a key part of long term adoption success.
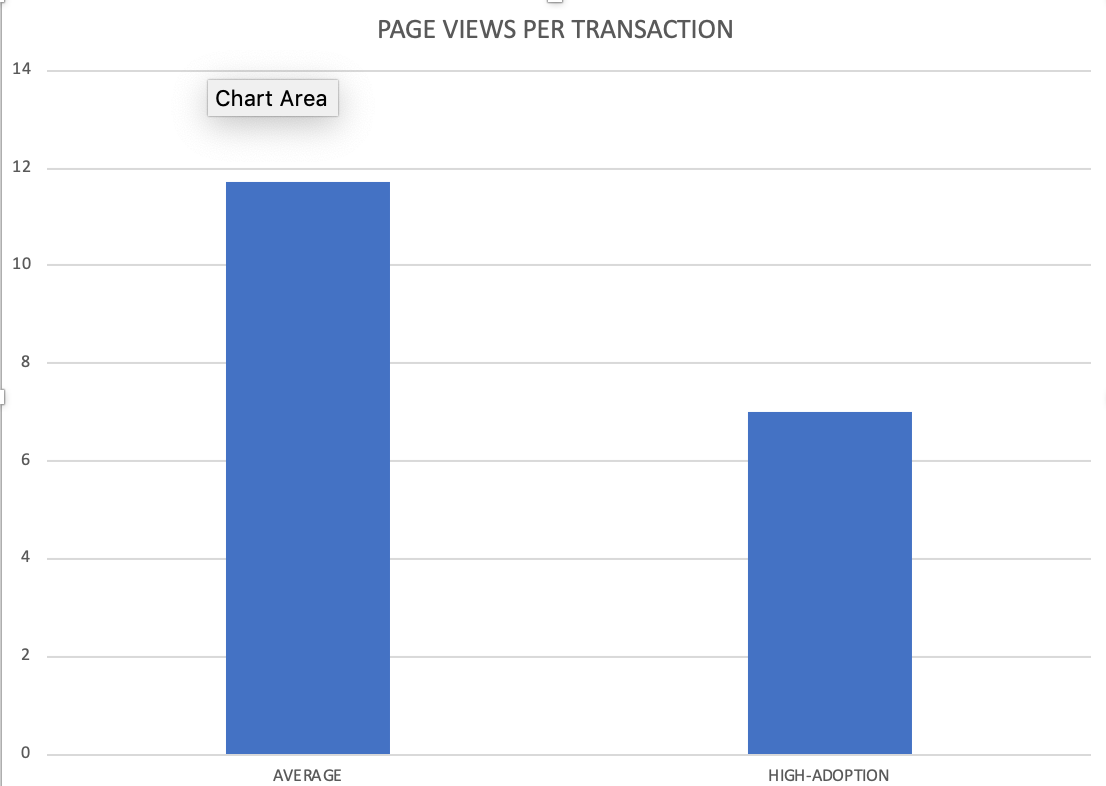
Loyalty, of course, is not merely a statistic. It’s a sign that users are getting value for the time they spend interacting with the system. Figure 2 shows the number of page views required, on average for users to complete a transaction on the DAM, which is one way of getting at the time that users invest in order to get value from the system.

Figure 2: Average ratio of pages views to marketing transactions on average versus high-adoption DAMs.
The difference we see here is stark. High adoption DAMs got their users to a meaningful transaction with 38% fewer page views. This might equate to a few minutes, or even just a matter of seconds. But with today’s demanding user communities, those seconds can mean the difference between making the DAM a staple of your online life — or just another tool that you occasionally use.
How do high-adoption DAM managers drive those page views downward?
- They update and curate their libraries constantly, to make sure hot or trending assets are available right off the home page. According to one of our high-adoption DAM managers, “We sweat over every detail of the home page on our system to try to get users as fast as possible to the thing they need — or the asset we believe could be most powerful for them right now.” (In an upcoming post in this series, we’ll talk about upload practices in detail.)
- They organize their content into groups or categories, to strike the balance between excessive “scrolling” and excessive “clicking”. In our high-adoption group, we found that DAM managers kept the number of clicks to get to the bottom of any category “nest” at five or fewer.
What these data indicate is that high-adoption is not something you achieve through a “set and forget” mentality. DAM administrators should be combing through the system regularly to weed out unused assets, upload and highlight the materials that local users most need, and in general keep the DAM looking fresh for each and every user’s next visit.
In fact, when we dove deeper into administrative behaviors in high-adoption group, we found that admin sessions accounted for more than 10% of all visits to the site—even though administrators represent less than 0.1% of the user community. That’s a big, continuing investment by the DAM manager, and it’s important for CMOs to recognize that this is the price of success.
August 2021 Update: Again, because of the success of recent client implementations, we have seen these data evolve. The most successful adoption over the most recent time period has occurred in systems where admin-engagement now represents 12% of all visits—a 20 percent average increase. This seems to indicate that administrators are spending more time curating their libraries—and are having a positive impact as a result.
Balanced Adoption
According to a recent survey of CMOs for distributed brands, one of the hallmarks of a distributed DAM is the presence of both static brand assets (which are used and/or delivered as is), and dynamic brand assets, which are edited by users to address specific local needs.
Across the applications we studied, the relative weighting of static to dynamic assets varied enormously — from a ratio as high as 42:1 (virtually all static) all the way to ratios as low as 0.01:1 (virtually all dynamic). But in the high-performing applications that we studied for this post, we found that all the systems came very close to an even 1:1 balance.
What conclusions can we draw from this data point? Likely it has to do with the urge local marketers have to get in and get out of the DAM quickly, having accomplished a specific job. If a static asset will fill the need—if it’s the fastest path to “done”—users seem happy with the result. But if customization is required, then the DAM should make that simple as well. And if the usage stats bear themselves out, about half the time, each approach is right for the user’s needs.
The wide variability in the data here, seems to indicate that the balance of static versus dynamic assets is specific to the individual organization. But to help ensure that you get the balance right, you need your DAM to be able to serve up both kinds of assets.
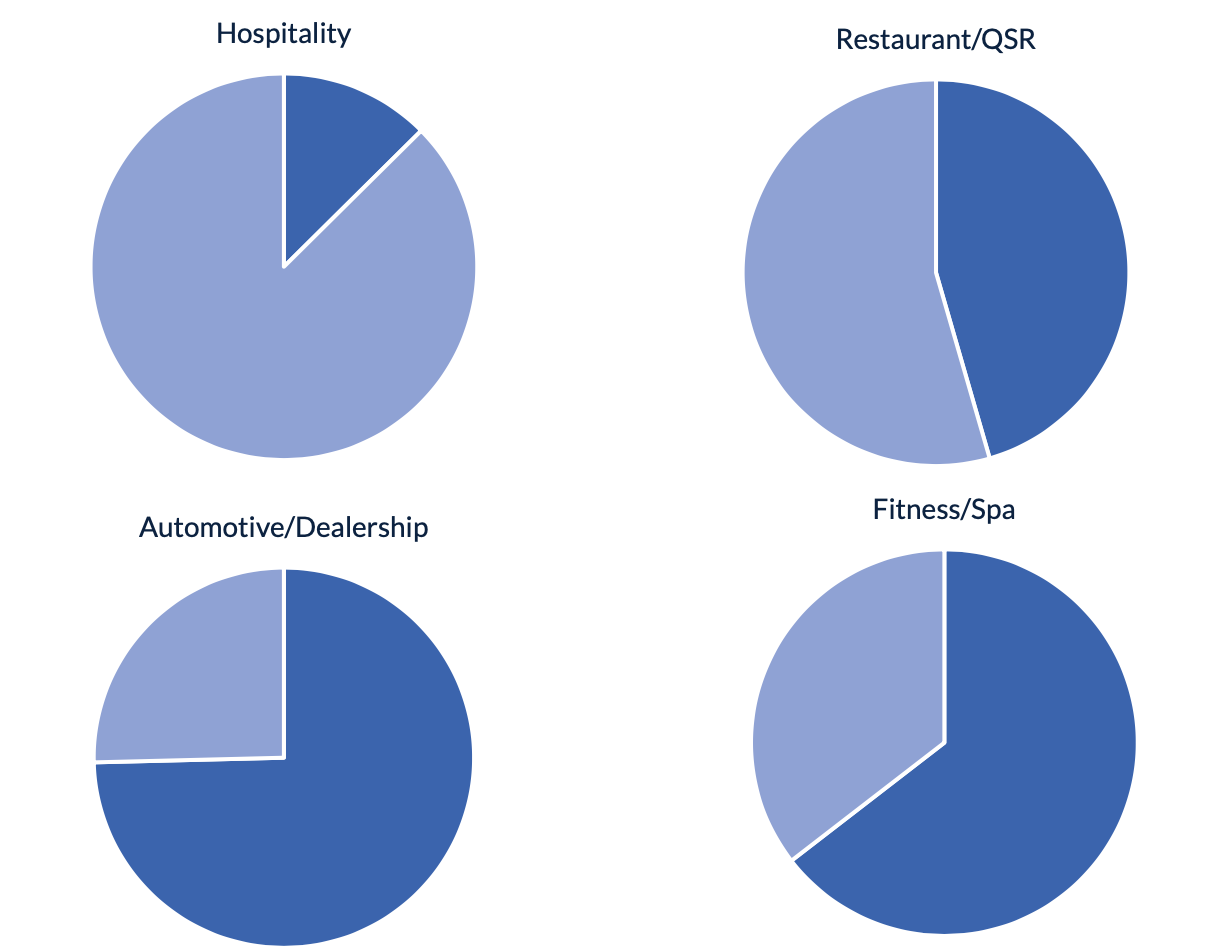
Figure 4 shows the balance between static and dynamic assets across various industries, to provide a sense of this variability.

Figure 4: The balance of dynamic and static assets can vary dramatically. You’ll need to experiment to find the right blend for your community.
August 2021: In the beverage/spirits industry, once again we see validation of broader trends. The balance of static assets to dynamic document generations was 53% to 47%, reinforcing the finding that balanced adoption is a strong predictor for continued success.
Key Takeaways
As a quick summary of the learnings we’ve found in this review of user adoption of dozens of enterprise-scale DAM systems, here are some important takeaways.
- DAM Adoption is up substantially from where it was several years ago—but that doesn’t mean success is assured. Monitor your active-registered user ratios at the 1-month, 3-month and 12-month marks, and work to improve those numbers continually.
- Curate your content relentlessly. A DAM that you set and forget will soon be forgotten. Try to add new content frequently, and publicize these additions to the DAM religiously.
- Train continuously. Provide live training as frequently as you can afford, and back it up with short video and image-based tutorials on specific DAM tasks.
- Information architecture is everything. Structure your library for ease of access. Aim to balance the amount of scrolling against the number of clicks to get to the bottom of a “nest”. And test the effects of your architecture regularly. Ask a colleague who’s relatively, but not intimately, familiar with your DAM to find a specific item and measure the time it takes him or her to complete the job. If you’re consistently above 1 minute, you’ve got work to do.
- Balance static and dynamic assets. Remember that brand management today is about providing freedom within a framework. Customizable and editable templates are consistently accounting for close to half of all downloads today. That means users have come to expect editability as a natural part of the user experience. Try to find the right balance for your brand, and listen to your users to see if you’re getting it right.

